


Four years ago, the City of Houston rebuilt a mile and a half of 11th Street through the Heights. Four general-purpose lanes became two, with protected bike lanes, pedestrian islands, and a center turn lane. It cost about $2.4 million.1
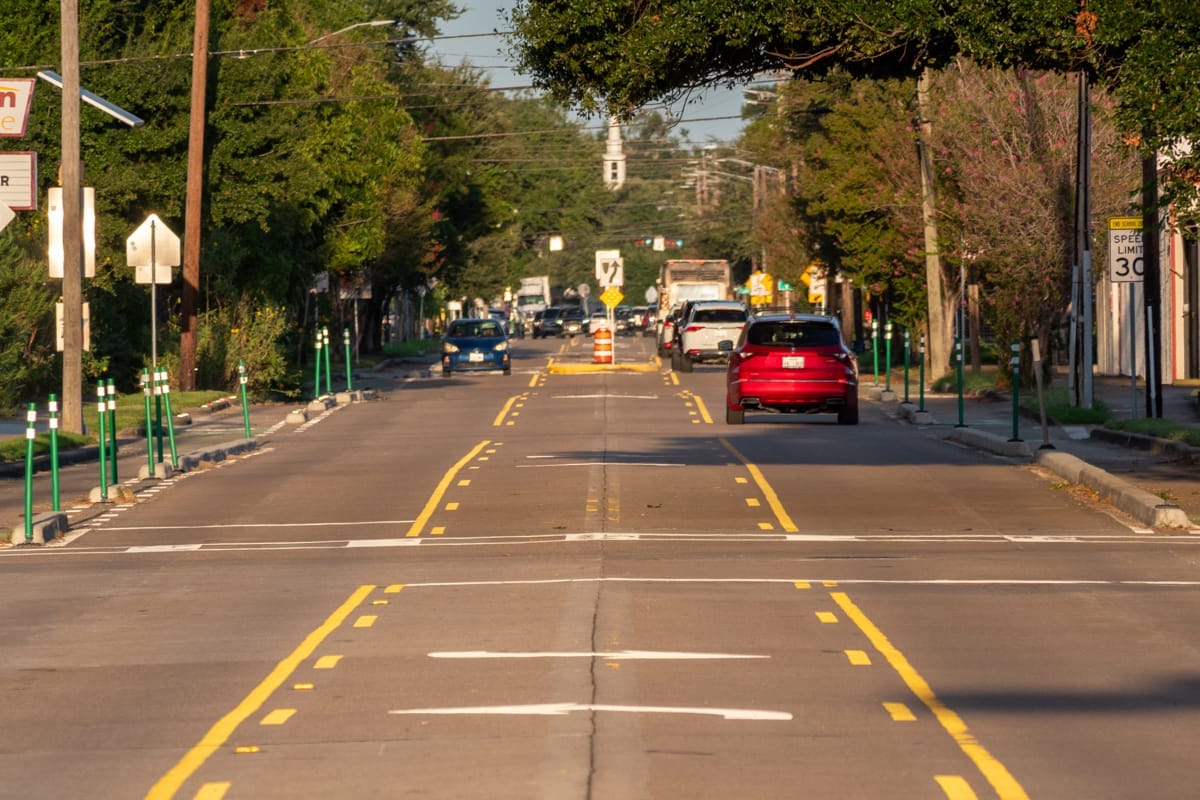
Above: East 11th Street, looking east on a Sunday evening (photo by the author)
Almost nobody in the neighborhood is neutral about it. One side will tell you the street is transformed, that people bike there now who never would have before, that the crashes have fallen. The other side will tell you it created gridlock, pushed traffic onto residential streets, and made everything worse. Both sides speak with total confidence. Both have been saying the same things since before the concrete cured.
The case for building it
The City made its argument on a public engagement page, and it gave three reasons.
The first was a statistic. As of 2019, the City claimed, 11th Street had a higher crash rate than the average four-lane undivided roadway in Texas. The page shows an outline of the state with two numbers printed on it: the Texas average at 356, and 11th Street between Shepherd and Heights at 385. Both numbers carry an asterisk. The asterisk is never explained. There is no footnote, no units, no source, anywhere on the page.2
The units turn out to be crashes per hundred million vehicle miles traveled, which is TxDOT’s standard measure of crash rate on a given segment of roadway. I can say that with reasonable confidence because I reproduced the number. Using the state crash database, the segment as the City defined it, and the year the City specified, I get 14 crashes for 2019;3 using the City’s own traffic counts, that works out to a rate near 405.4 The City published 385. That’s a 5% gap, well inside the margin you would expect from not knowing their exact segment boundaries.
So the arithmetic is sound; the problem is what was built on it. An 8.1% difference sounds meaningful, but it rests on 14 crashes in a single year, and 14 is a small number. The statistical uncertainty on 14 events is roughly plus or minus 27%.5 The gap the City highlighted is a third the size of the noise in its own measurement. Put in crashes rather than percentages: a rate of 356 corresponds to 12.3 crashes on that segment, and 385 corresponds to 13.3. The difference between 11th Street and the Texas average, going by the City’s figures, is one crash a year. On this evidence, 11th Street was indistinguishable from an average Texas road of its type.
That single claim — 11th Street is more dangerous than average — was repeated for years as the primary justification for the project.
There is one more thing about that statistic, and it may be the most important.
The graphic labels its segment, in small type inside the outline of Texas: “11th (Shepherd to Heights).” The project ran from Shepherd Drive to Michaux Street. Heights Boulevard is not the end of the corridor — it’s the middle of it. I measured both halves from the center of the Heights intersection: 3,837 feet west to Shepherd, 4,243 feet east to Michaux. So the statistic covers slightly less than half the street the project rebuilt, under a headline that says, without qualification, that 11th Street has a higher crash rate than average.
Run the same calculation on the whole project and the answer inverts. East 11th recorded 8 crashes in 2019 across a slightly longer stretch at comparable traffic volume — a rate of about 221, roughly 38% below the Texas average. Combine the two halves and the corridor comes out at 326: about 8% below average, not 8% above it.6
That figure still counts the Shepherd Drive intersection, which the project never touched; leave it out and the corridor drops to 311. And the result holds under every traffic volume the City publishes.7
I don’t know why the analysis stopped at Heights Boulevard, and I’d caution against assuming bad faith. The federal Road Safety Audit that generated this project centered on 11th at Nicholson Street, which is on the west side, and the Nicholson trail crossing drove much of the project’s design.8 A west-focused analysis may simply reflect where the work started.
And the scope is disclosed, if you count a parenthetical inside a graphic as disclosure. But a reader has no way to know that the boundary is doing any work — that Heights Boulevard is the corridor’s midpoint rather than its end, or that the unmeasured half is a markedly safer road. The claim above the graphic is about 11th Street. The number below it is about part of 11th Street. Moving the boundary to match the project’s own extent turns a street that is worse than average into one that is better.
The City’s second reason for the project was vehicle speed. The same engagement page states that typical speeds on 11th were 38.5 miles per hour, and illustrates the danger with a familiar graphic: a pedestrian struck at 20 mph has a nine in ten chance of surviving, at 30 mph five in ten, at 40 mph one in ten.
The number is real. 38.5 mph is what the City’s engineers measured on 11th between Ashland and Waverly in September 2019. What it is not is a typical speed. It is an 85th percentile — the speed exceeded by only the fastest 15% of drivers, and by construction a figure most drivers are traveling below. Calling it “typical” overstates the ordinary case by design. The engagement page does not say where the number came from, so a reader has no way to know they are being shown the fast tail rather than the middle.
And the graphic overstates the risk. The best American research on this question, from the AAA Foundation, puts the average risk of death for a struck pedestrian at 10% around 23 mph, 25% around 32, 50% around 42, and 90% not until around 58.9 At 40 mph, roughly 45% of struck pedestrians die — serious enough, but half what the graphic claims. The numbers in that image trace back to British crash data from the 1960s and 70s — and they were never a fair description of pedestrian crashes generally. The researchers who collected that data said so themselves in 1977, warning that their sample was skewed heavily toward the severe end and could not be used to make general claims about risk at a given speed. The warning was overlooked. The figures were repeated anyway, for decades, until newer and better-sampled research finally displaced them.10 Houston didn’t invent the graphic; it circulates widely in street-safety campaigns nationwide. The graphic looks authoritative, it appears in official presentations, and it’s been wrong from the start.
The third reason was that residents reported difficulty crossing 11th on foot and by bike. That one is offered as what it is — community feedback — and I have no quarrel with it.
The City’s own evaluation
The City also promised to check its work. Six months after construction was substantially complete, it would collect traffic volume and speed data. Mayor Turner ordered the analysis before leaving office. A draft was substantially completed on March 16, 2024, and sent to Mayor Whitmire’s office for review.
It concluded that the project worked: speeds down at eight of twelve measured locations; crashes on 11th down from 25 to 16 over a six-month window, with injury-causing crashes down from three to zero; pedestrian and bicycle crossings at the Nicholson Street Trail up 195%. And a dollar figure: the annualized societal cost of crashes falling from $2,905,600 to $536,800, which the report turns into a benefit/cost ratio of 13.9.
You can read it, and I’d encourage you to. It became public in June 2024, when Axios obtained a copy and posted it; the City has never published it itself, and as far as I can establish no version newer than that March 2024 draft exists.11
The draft also contains a sentence worth pausing on, given what it concludes: six months of crash data, it says, is not sufficient to assess crash patterns.
That is almost certainly true. It sits awkwardly beside a report announcing fewer and less severe crashes. And it is a standard the same department did not apply when it justified building the project, using one year of crash data at one corridor. Both statements may be defensible alone. Together they describe a bar that moves depending on which way the answer points.
What the speed data shows
This is the clearest finding in the whole exercise, and it comes entirely from the City’s own measurements.
The project’s stated goal was to encourage speeds more in line with the legal limit. That limit is 30 mph on every part of 11th in the project. Here is what the City measured, September 2019 against October 2023, at the three points on 11th with before-and-after data:
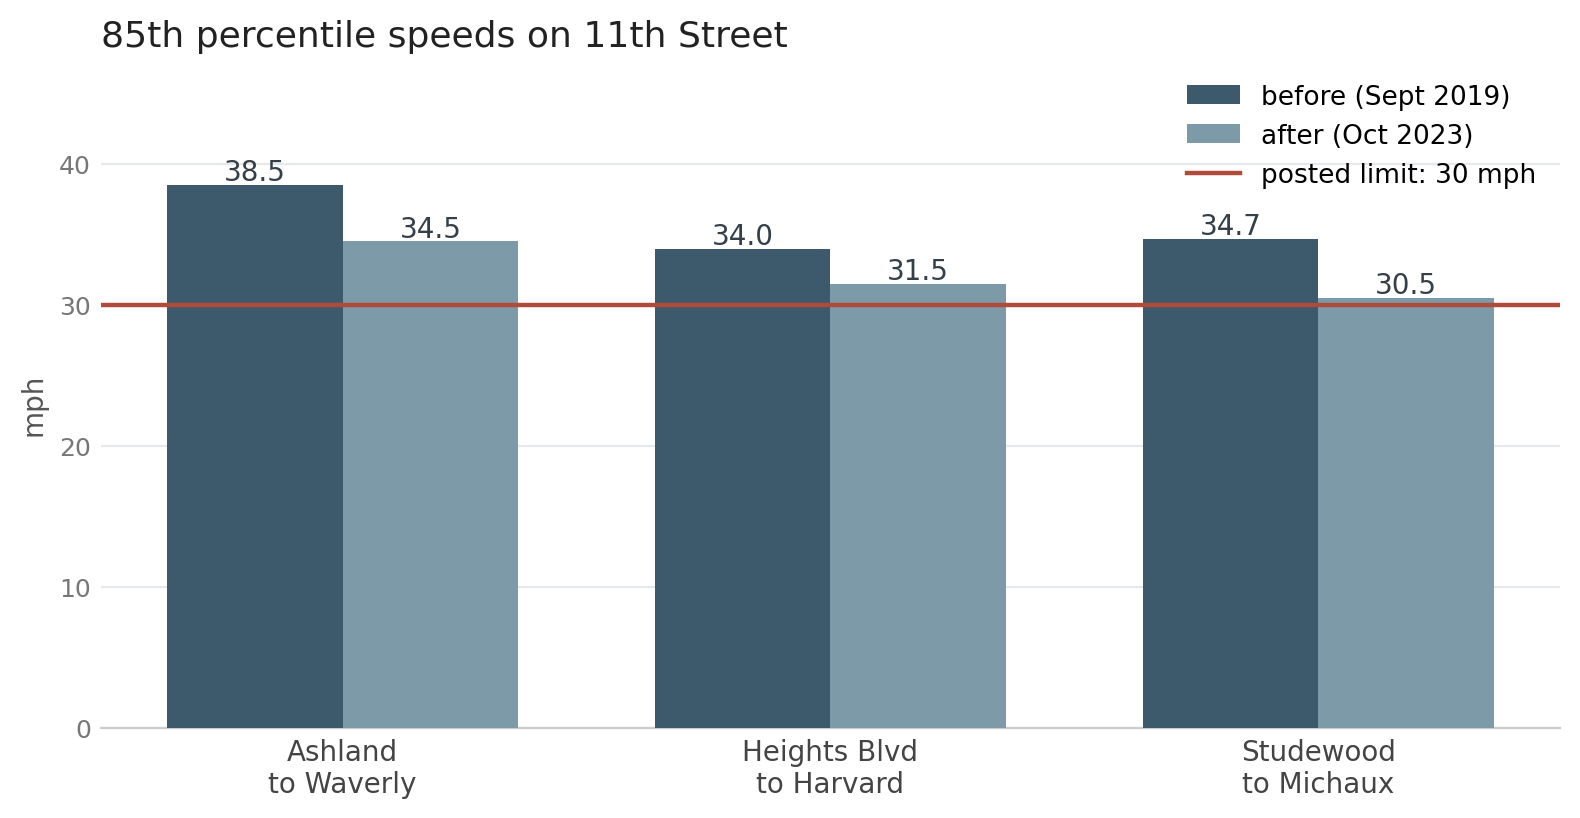
Speeds fell at all three, by 2.5 to 4.2 mph. All three remained above the posted limit afterward.
The report says as much itself, and the candor deserves credit: while typical speeds still exceed the posted speed limit, it notes, the discrepancy has been significantly reduced. That is an accurate description of its own data. It is also an admission that the goal as stated was not reached at any location measured.
There is a second detail in that table. Southbound Heights Boulevard, which the project did not rebuild, got faster — from 31.0 to 34.0 mph. The report attributes this to signal changes made at Heights and 11th as part of the project, and notes that the speed stays under the 35 mph limit posted there, which was true at the time.12
What the crash data shows
Counting crashes on a stretch of road sounds like arithmetic. It isn’t, and the reason matters for how much weight any number can carry.
Two questions have to be answered before you can count anything, and neither has an obvious right answer.
The first is which crashes belong to 11th Street. A collision at 11th and Nicholson may be recorded with Nicholson as the primary street and 11th as the cross street. Count those and you get one number; leave them out and you get a number 26% smaller. Both rules are defensible — one asks what happened at this place, the other asks what the state attributes to this road — and they answer different questions.
The second is the Shepherd intersection at the corridor’s west end. It’s a busy crossing that generates a lot of crashes, between three and ten a year, with no pattern I can find. The project made no changes to it whatsoever. Should its crashes count in an evaluation of the project? Including them moves the total by 30% — nearly four times the size of the entire difference the City’s own justification rested on.
Neither of those choices has been disclosed by anyone: not by the City, not by the project’s advocates, not by its critics. And the answer moves substantially depending on how you make them.
What I settled on is a rule that doesn’t depend on my judgment about where the corridor starts and stops. Identify each crash by what the record itself says — the street name, the address, the cross street, and a field indicating whether it happened at an intersection — and let those fields decide. Cast the net far wider than the corridor and filter on the record rather than the geography.13
That rule also caught something I wasn’t looking for. The state’s records include 171 crashes on 10th Street classified as Interstate crashes — collisions on I-10, more than a mile south, filed under a residential street. It’s a real defect in the state database and I’ll write about it separately; here it’s enough to say that any count of crashes on a street numbered 10 is wrong unless you screen for it.
On this basis, here is the ten-year series for the whole corridor, Shepherd to Michaux:14
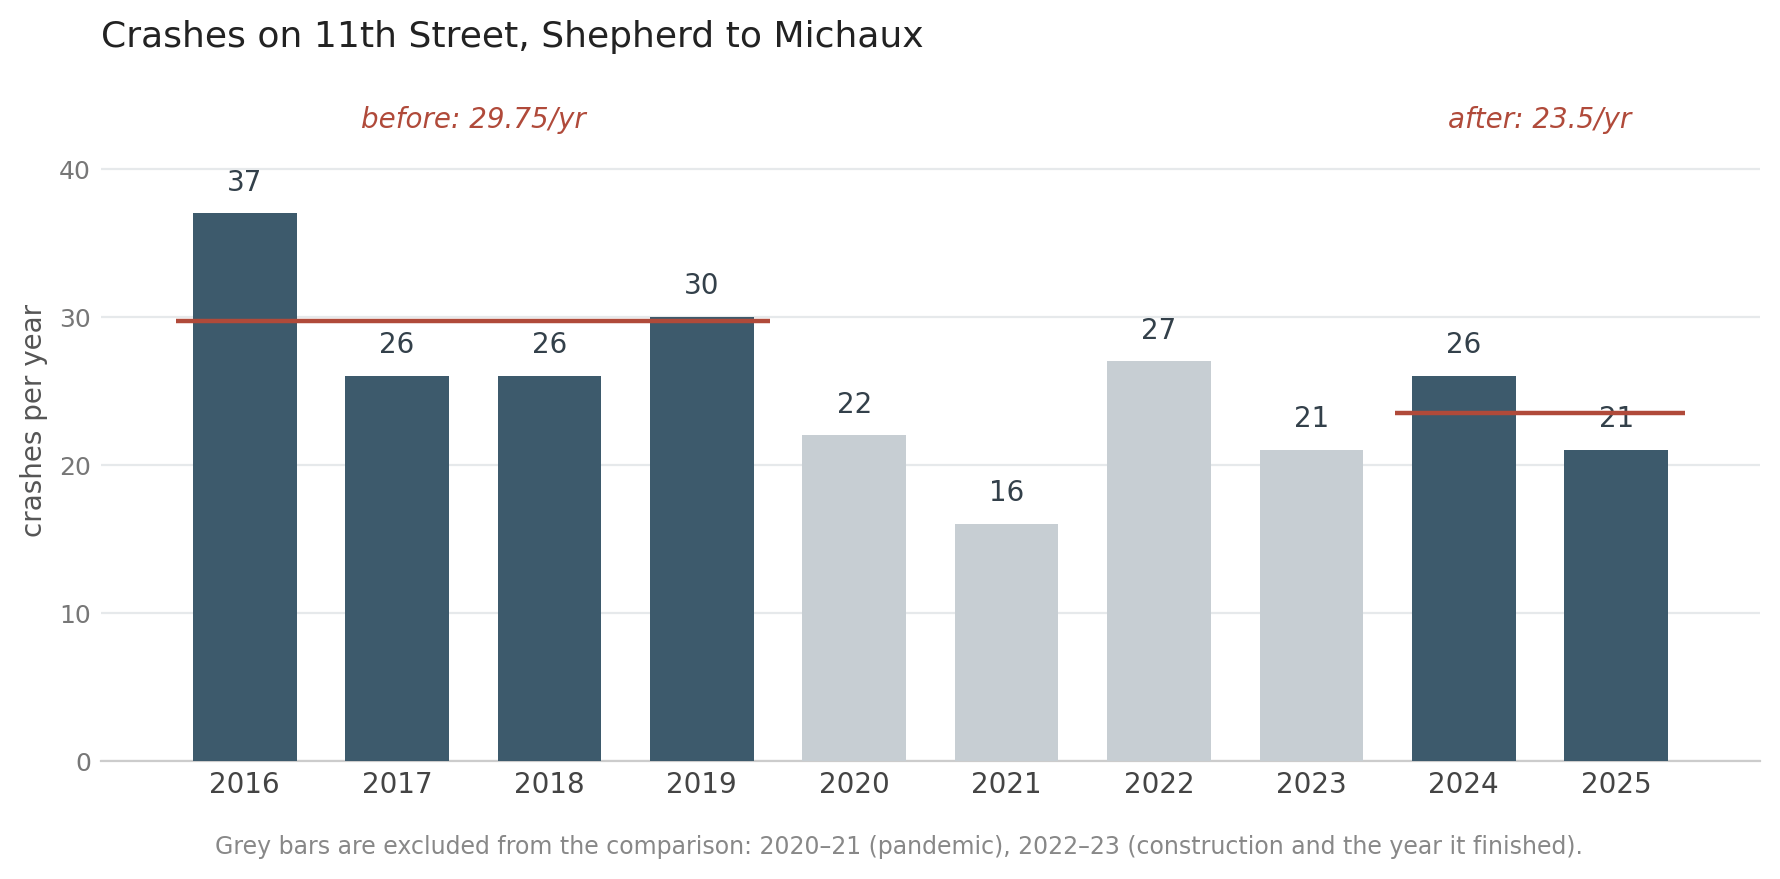
Just under 30 crashes a year before the project, 23.5 after — a decline of 21%. This sounds like good news, until you account for the traffic.
The goal the City actually set
There is a problem with everything I just did, and it’s mine, not the City’s.
The report’s stated crash goal was not to reduce crashes. It was to reduce injury-causing crashes, in line with the City’s commitment to Vision Zero. That’s a narrower and more meaningful target, and it deserves to be measured on its own terms.
Texas classifies crashes on a five-point scale — fatal, suspected serious injury, suspected minor injury, possible injury, and no injury. The City counts the first three as injury crashes. Pulled out of the same corridor series:
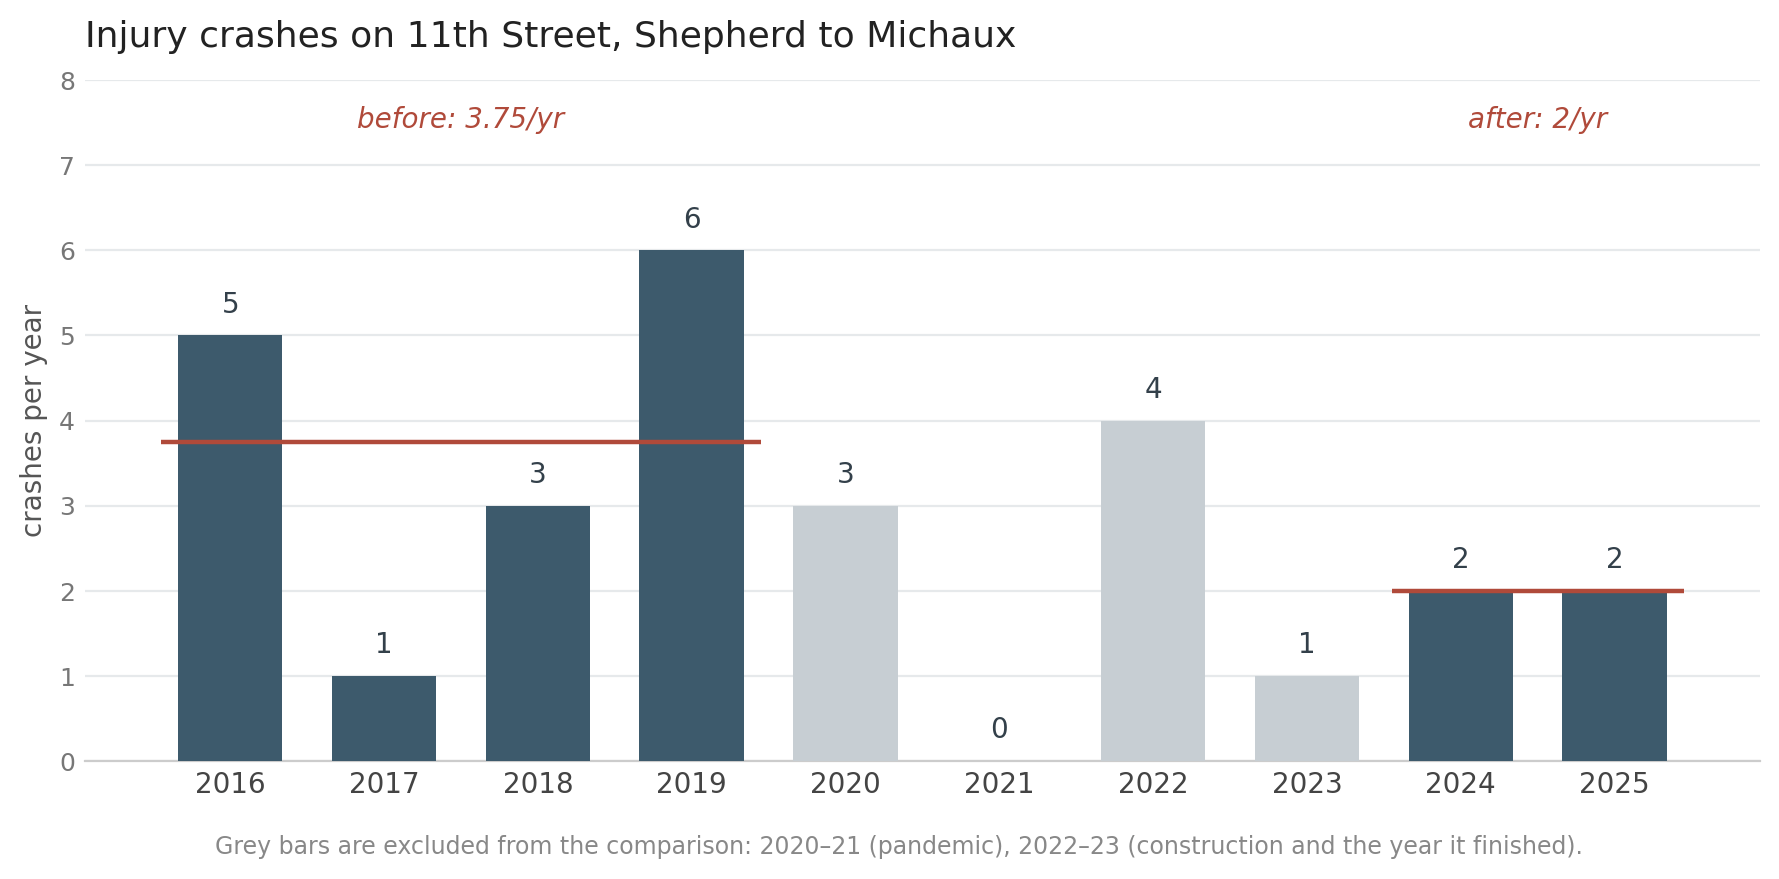
3.75 injury crashes a year before the project, 2 after — a decline of 47%. And unlike the all-crash figure, this one survives the traffic adjustment with a great deal left over: roughly a 33% reduction per vehicle-mile.
On the goal the City actually set, the numbers are favorable. I want to be plain about that, because it is the strongest result anywhere in this analysis and I nearly missed it by measuring against the wrong thing.
It is also 15 crashes against 4. The uncertainty on counts that small runs from roughly 1.9 to 5.7 a year before and near zero to 4.0 after — ranges that overlap across most of their length. The two post-project years are 2 and 2; the four pre-project years are 5, 1, 3, and 6. One year in either period could reverse the sign.
So the fair statement is this: on its own stated goal, the project’s numbers moved in the right direction, by a margin large enough to matter and on a sample too small to confirm. That is not nothing. It is also not what a $2.4 million project’s evaluation ought to rest on four years later, and it is not the kind of evidence either side of the argument claims to have.
The traffic that disappeared
Crash counts don’t mean much without knowing how many vehicles were exposed. Fewer cars tend to produce fewer crashes whether or not anything got safer.
Traffic on 11th Street fell substantially: 14% at the west count point, 25% at the east. Weighted across the corridor, that’s about a 20% decline in exposure — slightly larger than the 21% decline in crashes. Adjust for it and the all-crash improvement almost entirely evaporates, leaving something on the order of 1% better per vehicle-mile, which is well inside the noise. The point is not that the corridor got more dangerous; it’s that the raw decline in crashes is smaller than the decline in the traffic producing them. The injury-crash decline is the one that survives this adjustment, and it survives because it was much larger to begin with — but it is also the one resting on five crashes.
But the traffic counts contain something more interesting than that.
The City measured 13 locations before and after. Traffic fell at 10 of them. The parallel residential streets did pick up cars — West 10th up 38%, West 12th up 35%, East 12th up 98% — and those percentages are what the project’s critics point to. (East 10th has no before count at all, so there is no way to say what happened there; it now carries about 1,274 vehicles a day.)
In actual vehicles, those three increases combine to about 1,200 a day. That is a real change for the streets absorbing it — East 12th nearly doubled, from 639 vehicles a day to 1,273 — though all three (and also East 10th) remain under the 1,500 a day the City’s own design manual anticipates for residential streets. Meanwhile, 11th Street lost roughly 5,000 at its two count points, Yale Street lost about 3,000, and Heights Boulevard about 2,700.
The changes in volume across all 13 locations sum to a net decrease of about 9,300 vehicles per day.
This is not a picture of traffic being pushed from one street onto another; it’s a picture of an entire neighborhood driving less. Why is a harder question than it looks. Some of it may be the project: the redesign restricted left turns at Heights Boulevard and made 11th less useful as a through route, and drivers avoiding the corridor might avoid the surrounding streets too. Some of it may be unrelated. The City’s own report notes ongoing construction on Shepherd and Durham during the same period. And the Heights sits about two miles from downtown, where commuting patterns have not recovered: in July 2023, three months before these after-counts were taken, the volume of vehicles traveling into downtown Houston daily was still 17% below pre-pandemic levels, and transit use across the region was down 24%.15 These counts can’t separate those. What they do establish is that the decline isn’t confined to the street that was rebuilt, which is worth knowing before attributing 11th Street’s own drop to the road diet alone.
It also complicates the displacement argument. More cars do use 10th and 12th than before, and residents there have noticed. But Yale and Heights Boulevard between them lost more traffic than 10th and 12th gained, and the project rebuilt neither.
The one test that gives a clear answer
Everything above depends on choices I had to make. But there’s one question the data answers without any of them, because it compares crashes to other crashes rather than to a volume estimate: did the kinds of collisions change?
This matters because the City said exactly what should happen. Its justification page lists the crash types that four-lane undivided roads produce, and that the redesign would address: rear-end and sideswipe collisions from speed differences between lanes; sideswipes from cars changing lanes; rear-end crashes behind vehicles waiting to turn left; and angle crashes from side-street traffic trying to cross four lanes at once.
Those are predictions. Here is what happened.
Angle crashes fell, from about 10 a year to 6. The City got that one right — with one lane in each direction instead of two, there’s less road for cross traffic to get across.
Sideswipes barely moved, from about 4 a year to 3, despite eliminating the side-by-side through lanes that were supposed to cause them.
And rear-end collisions — crashes into stopped or slowing vehicles — nearly doubled as a share of the total, from 18% to 35%. In absolute terms they went from about 5 a year to 8.5, while total crashes were falling.
It is the only category that increased. Everything else declined.
The explanation isn’t mysterious, and it isn’t a scandal. When a road has two lanes in each direction, a driver who encounters a stopped car can go around it. With one lane, they have to stop. That trade-off is documented in the engineering literature on road diets. It is a known consequence of the design.
But the City listed rear-end crashes among the problems this project would solve.
I checked whether construction explained it. During the build and the year after, when temporary striping and unfamiliar conditions would be at their worst, rear-end crashes were 17% of the total — essentially identical to the 18% before the project. The share doubles only after everything is finished and settled. It tracks the completed design, not the building of it.
I should be careful here. The after period is 2 years and 48 crashes; the 17 rear-end collisions in it carry an uncertainty of roughly a quarter. The shift is large enough to survive that, but it’s one finding from a small sample, and I’d want more years before treating it as settled.
The third goal
The project had a third stated goal I have not yet touched: improving safety for people walking and biking along and across 11th Street, with particular attention to the Nicholson Street Trail crossing. That crossing is the reason much of this project exists. Community complaints about it go back years, and a 2018 federal Road Safety Audit at that intersection is what produced the design.
The report’s evidence that this worked is a count of people crossing. Pedestrian and bicycle crossings at Nicholson rose from 211 to 623, an increase of 195%.
It is a striking number, and it rests on two days of counting five and a half years apart. The before count was taken on Thursday, September 6, 2018, when the high was 88 degrees. The after count was taken on Wednesday, February 28, 2024, when the high was 73. The report notes both days had fair weather. It does not mention that one of them was a Houston afternoon in September and the other a mild afternoon in late winter — and it reports, in the same passage, that morning volumes were similar between the two days and the increase came in the afternoon and evening hours. Which is precisely when an 88-degree day suppresses walking and cycling and a 73-degree day does not.
Something may well have improved at that crossing. The report also describes video showing drivers stopping for trail users where they previously did not, which is a different kind of evidence and a more persuasive one. But 195% is not a measurement of that. It is a comparison between a hot day and a pleasant one.
What I think this adds up to
Not that the project failed. I can’t support that, and the angle-crash reduction is real. Not that it succeeded either. What the public data supports is narrower and, I think, more troubling than either verdict.
The speed goal was not met. That’s measurable in the City’s own figures, and it isn’t close.
Overall crashes fell by less than traffic did, so per vehicle-mile the corridor is no better and possibly marginally worse — all of it inside the noise. However, injury crashes — the second stated goal — fell 47%, and roughly 33% per vehicle-mile. That is a real result, on a sample of 15 crashes against 4.
The third goal, the Nicholson crossing, may well have been met. But the number offered to show it compares one day in September to one day in February.
The crash mix moved toward the conflict this design is known to create, in the one category the City specifically promised to reduce.
Put those together and a pattern emerges that I did not expect when I started. Every measure moved a little. None moved the way anyone said it would.
That distinction is worth being precise about, because “we can’t tell” is doing two different jobs in this essay and only one of them is a limitation. Where the measurements are strong, they show small effects. The 85th percentile speed is a stable statistic drawn from thousands of vehicles, and it fell between 2.5 and 4.2 mph — real, modest, and still above the limit. Thirteen traffic count points show a neighborhood driving less. Those are findings, not gaps.
Where the measurements are weak, they are weak in a specific and useful way. With about 30 crashes a year before and 23 after, the data would have revealed a large effect if one existed. A halving of crashes would be visible. A doubling would be visible. Neither is there. What the data cannot resolve is anything smaller — a 15% improvement and a 15% worsening look identical at this sample size.
So the argument as it is actually conducted can be settled, and the answer is that both sides are wrong. The project did not transform this street and it did not ruin it. Large effects in either direction are excluded by the evidence. Small ones cannot be measured at all, and small ones are what happened.
Meanwhile, the argument continues in the neighborhood’s Nextdoor groups, with undiminished certainty in both directions.
The more troubling finding is underneath that. A $2.4 million project was justified by a single number from a single year that could not statistically distinguish this street from an average one, and evaluated in a report that announced success while disclaiming its own crash data. Both documents were produced in good faith by people doing their jobs. Neither can carry what was built on it. Four years on, the most confident thing anyone can say about 11th Street is that not much happened, and that nobody assembled the evidence that would let us say more.
Internal City correspondence obtained under the Texas Public Information Act (request W320194, submitted to Houston Public Works 7/8/2026, records released 7/23/2026) gives the figures to the cent: $717,763.51 for the asphalt mill and overlay, carried out through the Street Rehabilitation program; $1,573,036.90 to implement the safety project; and a $225,000 design contract covering both 11th Street and Patterson Street, weighted roughly 60/40 toward 11th. Safety implementation plus 11th’s design share comes to $1,708,036.90 — the “$1.7 million cost of the project” the City’s March 2024 report divides into its projected benefit to reach a benefit/cost ratio of 13.9. Including the mill and overlay, the total is $2,425,800.41, and the same benefit yields a ratio of 9.8. The exclusion is arguable: repaving was separately funded and would likely have happened anyway. But the report gives only the single figure, with no indication that a $717,763.51 phase of work on the same stretch of road sits outside it.
City of Houston, “11th Street Bikeway” FAQ, Let’s Talk Houston — see the answer to “Why are you proposing street safety improvements on 11th?” Axios approximated the same comparison as “10% more crashes”; the City’s own figures give 8.1%.
15 crashes if the Shepherd Drive intersection itself is counted, which would give a rate near 434 instead. The City’s label — “Shepherd to Heights” — doesn’t say which it did. More on that intersection below.
Segment length measured at 3,837 ft (0.727 mi), from the center of the Heights Blvd double intersection west to Shepherd Dr; ADT of 12,992 from the City’s own before-counts. Rate = crashes × 100,000,000 ÷ (365 × ADT × miles).
Crash counts are conventionally treated as Poisson-distributed — independent events occurring at some underlying average rate. For a Poisson count, the standard deviation is the square root of the count itself: √14 ≈ 3.7, or about 27% of 14. That is one standard error. A conventional 95% interval is roughly twice that, running from about 7 crashes to about 21 — which on this segment corresponds to rates between roughly 190 and 620 per 100 million vehicle miles. Put another way: a street whose true underlying rate produced 14 crashes in an average year would, by chance alone, routinely produce counts anywhere across that range.
Full disclosure of what that comparison rests on: “Average” here means the City’s stated Texas average of 356, because the City’s claim is what’s being tested. TxDOT’s own published statewide rate for urban roadways with four or more lanes, undivided, is lower — and I have not been able to reconcile the two. The 2019 figure reads 325.38 in the edition published April 2021, 325.65 as revised in March 2023, and 321.35 as revised in April 2025; no year between 2010 and 2023 exceeds 336. A former Houston Public Works engineer who worked on the project’s after-study tells me the department used TxDOT’s statewide averages, and I have no reason to doubt him, so I am not suggesting the number was invented. But measured against roughly 325 rather than 356, the full corridor lands essentially at the state average rather than below it, and the inversion I describe above becomes a levelling instead. The scope point survives either way — the western half is well above average and the corridor as a whole is not — but the size of the effect depends on a benchmark I can’t reproduce.
Full-corridor rate by volume basis: 326 at ADT 12,992 (traffic count document), 309 at 14,450 (report Table 6), 308 at 14,500 (the FAQ’s “around 14,500”). Excluding the Shepherd Drive intersection: 311, 295, 295. All below 356. West 11th alone runs 435 including Shepherd and 406 excluding it; East 11th, 221.
Houston Public Works, "Safer Streets Initiative Update", presented to the City Council Transportation, Technology and Infrastructure Committee, February 7, 2019. The audit team included the Federal Highway Administration, Houston Public Works, the Houston Police Department, METRO, the Planning and Development Department, BikeHouston, LINK Houston, and TxDOT. Reducing 11th Street from four lanes to three was among the audit's preferred recommendations for that intersection.
Brian C. Tefft, “Impact Speed and a Pedestrian’s Risk of Severe Injury or Death”, AAA Foundation for Traffic Safety (2011); published in Accident Analysis & Prevention 50 (2013): 871–878.
The figures derive from pedestrian crash data collected by S.J. Ashton and G.M. Mackay in Birmingham, England, during the 1970s (Ashton & Mackay 1979; see also Ashton 1980). RoSPA notes the study is now regarded as having overestimated the risks. The UK’s THINK! road-safety campaign used figures based on Pasanen’s 1992 reanalysis of that data and withdrew them after newer research appeared in 2010. The reason is sample bias rather than any change in vehicles. Ashton and colleagues reported in 1977 that their Birmingham sample contained 20% fatalities against a national figure of 3.5%, and warned that it could not be used to describe pedestrian crashes generally — a caution subsequent work overlooked. Rosén et al.’s 2011 review of the literature found nine of eleven studies similarly biased toward severe outcomes. Adjusting the same 1960s–70s data for that bias brings the risk curve down substantially.
Jay R. Jordan, “City of Houston draft report touts 11th Street’s success,” Axios Houston, June 17, 2024. The report is posted on Google Drive, and because links to files hosted that way tend not to last, I have archived a copy. How the document reached the public, and what the City has and hasn’t said about it since, is a story of its own; I’m leaving it out here because this essay is about whether the project worked rather than about how hard the answer was to obtain, and I intend to write about it separately.
Heights Boulevard is posted at 30 mph today, a change that was made well after the project was completed.
The rule: exclude anything TxDOT classifies as an Interstate crash (see below); keep records naming 11th Street as the primary street within the corridor’s address range; keep records naming 11th Street as the cross street; and for records with no cross street listed, keep those in the 1090–1110 block range flagged as occurring at an intersection. Segment assignment — west or east of Heights Boulevard — is by latitude and longitude rather than by street name, since some records are named against their actual location. Applied to selection areas of very different sizes, this produces counts agreeing within a couple of percent.
2016–2025, TxDOT CRIS, all crash types, West and East 11th combined and de-duplicated. 2020 and 2021 are excluded from the before/after comparison for the obvious pandemic reason, and 2022 and 2023 because construction ran from November 2022 to the end of March 2023. These counts exclude the Shepherd Drive intersection, on the reasoning given above — the project made no changes there, so its crashes aren’t the project’s to claim or answer for. Including it gives 35 crashes a year before and 29 after, a decline of 17% rather than 21%, and injury crashes of 4.5 and 2.5.
Dug Begley, “Houston downtown traffic still down 17 percent from pre-COVID,” Houston Chronicle, July 26, 2023, reporting an INRIX analysis that found 18 of 20 large U.S. downtowns still below their pre-pandemic vehicle trips. Regional traffic is a different story: INRIX’s 2024 congestion report found Houston congestion 1% above 2019 levels, and Houston TranStar recorded all-time highs for freeway congestion in 2024. The decline here is local, not citywide.